Note: Please write your answers in the answer book only.
All answers should be properly explained by providing appropriate detailed
arguments, reasoning, formulas, diagrams, etc..
Q1a Let
![]() ;
calculate the 4 point discrete Fourier transform, X=fft(x).
Compute the real part,
;
calculate the 4 point discrete Fourier transform, X=fft(x).
Compute the real part, ![]() of X, the imaginary part,
of X, the imaginary part,
![]() of X, the even part,
of X, the even part, ![]() of X,
and the odd part,
of X,
and the odd part, ![]() of X. Hint: each of these four answers should contain
four samples.
of X. Hint: each of these four answers should contain
four samples.
Q1b Compute the 2 point DFT of the following signals:
![]() being the DFT of [1, 3] and
being the DFT of [1, 3] and ![]() being the DFT of [2, 4].
being the DFT of [2, 4].
Q1c Is the 2 point DFT of a real signal of length 2 always real, and if so, why?
Q1d Show how ![]() can be reconstructed using the results in Q1b.
Hint: write each sample of
can be reconstructed using the results in Q1b.
Hint: write each sample of ![]() as a linear combination of the samples
of
as a linear combination of the samples
of ![]() and
and ![]() .
.
Q1e Now consider
![]() , where
, where ![]() is an odd function.
(Recall that
for an odd function,
is an odd function.
(Recall that
for an odd function, ![]() and
and
![]() ,
where
,
where ![]() is the number of samples in
is the number of samples in ![]() .)
If
.)
If ![]() has a length of four samples, how many degrees of freedom are there
in
has a length of four samples, how many degrees of freedom are there
in ![]() ?
?
Q2a Consider a real signal ![]() having an arbitrary length
having an arbitrary length ![]() .
We desire to find the
.
We desire to find the ![]() point DFT of
point DFT of ![]() , as defined by:
, as defined by:
![]() , using a single
, using a single ![]() point DFT. What's the minimum
point DFT. What's the minimum ![]() required, given no additional knowledge
of
required, given no additional knowledge
of ![]() .
.
Q2b Show how you can compute ![]() using a single
using a single ![]() point DFT.
Hint: consider a decimation-in-time or decimiation-in-frequency approach,
combined with some thoughts on question 1.
point DFT.
Hint: consider a decimation-in-time or decimiation-in-frequency approach,
combined with some thoughts on question 1.
Q2c In situations where ![]() is an odd function, what is the
minimum
is an odd function, what is the
minimum ![]() required to obtain the
required to obtain the ![]() DFT of
DFT of ![]() from the
from the ![]() point DFT of
point DFT of ![]() .
.
Q2d Show how you would obtain the ![]() point DFT of a real and odd
function using a single
point DFT of a real and odd
function using a single ![]() point DFT, where
point DFT, where ![]() is as found in Q2c.
is as found in Q2c.
Q3 Design a single pole causal lowpass filter, ![]() having real
coefficients
having real
coefficients ![]() and having -40dB gain at 22.05kHz.
You are to use the bilinear transform, with
and having -40dB gain at 22.05kHz.
You are to use the bilinear transform, with ![]() .
For your final design, provide both
.
For your final design, provide both ![]() and its impulse response
and its impulse response ![]() .
.
Q4a Explain how you would rescale an array having dimension 400 (down) by 600 (across) up to an array having dimensions 480 by 640. Hint: recall the resampling (resizing) done in lab 2.
Q4b Suppose that you measure the same array quantity again and again in a large number of separate measurement trials. The measurements are quite similar but slightly different due to random noise. Would it be best to simply select one of the measurement arrays at random, or is there a better approach than just selecting one at random. Explain your reasoning. Hint: recall lab 1.
Q5a Compute the comparagram of the following two image arrays:
image 0      image 1

1 3 2 3      2 3 3 3
1 2 1 2      1 2 2 2
0 0 2 0      0 1 3 1
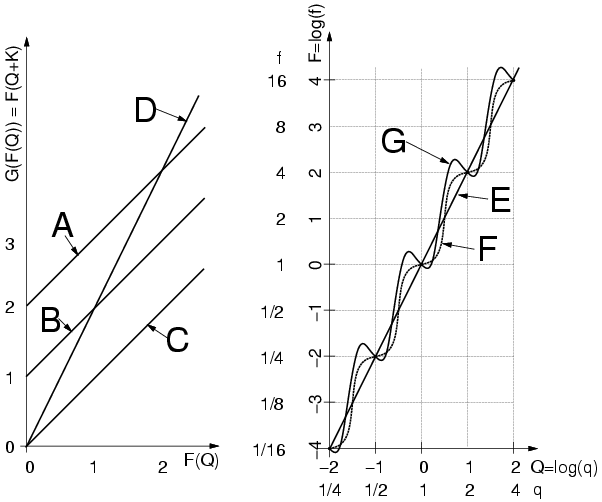
Q5b With reference to the figure below,
which of the following comparametric plots at left
correspond to possible candidate
solutions shown at right. Identify which solutions
correspond to which comparametric plots, if any, for any that are solutions.
Explain your reasoning. Note that logarithms are base 2, and ![]() .
.
